
Body Fat Charts
The percentage of body fat you have affects not only your weight and shape, but also affects your health.
Q. How much body fat is too much, or even too little?
A. That depends on two important factors, whether you are a man or a woman, and how old you are.
Below are four body fat charts that show body fat ranges for the whole family. There is a body fat chart for men aged 7-18, men aged 18-79, women aged 7-18 and women aged 18-79.
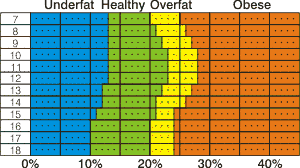
Male 7-18
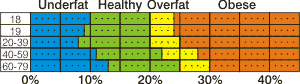
Male 18-79
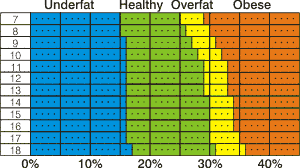
Female 7-18
Female 18-79
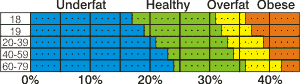
When comparing a body fat chart for men to a body fat chart for women you can see that women steadily increase their percentage body fat as they go through life, staying within a healthy fat range. Whereas male body fat percentage fluctuates during puberty before following the same adult pattern in body fat increments seen in the body fat chart for women.
And throughout life from adulthood women can have a body fat percentage 10% higher than a man of the same age who is of a healthy body fat range and still be in their healthy body fat range.
Charts supplied courtesy of Tanita Ltd, data from:
Body Fat Ranges for Standard Children
Body Fat Reference Curves for children Targeted at BMJ (British Medical Journal) Draft 1-AMP 19 June (by Dr Andrew)
Gallagher D et al. Am J Clin Nutr 2000,72:694-701. "Healthy percentage body fat ranges: an approach for developing guidelines based on body mass index."
Body Fat Ranges for Standard Adults
Based on NIH/WHO BMI Guidelines
As reported by Gallagher, et al, at NY Obesity Research Center. To determine the percentage of body fat that is appropriate for your body, consult your physician.